

The Best Third Methodology
Overview
The Best Third (TBT) provides a process for allocating retirement assets and converting those assets into after-tax, inflation-adjusted retirement income. The asset allocation is between a stock index fund and a ladder of Treasury Inflation-Protected Securities (TIPS). This document outlines TBT methodology as it is implemented in the software. It describes:
- The conceptual framework
- The user inputs
- The inflation assumption
- The tax modeling framework
- Asset allocation and location logic
- Withdrawal sequencing
- Stock return assumptions and the withdrawal formula
- The TIPS ladder construction process
- How to interpret the output, with a specific example
- Plans for future work
The methodology extends Stefan Sharkansky’s Financial Analysts Journal article, “The Only Other Spending Rule Article You Will Ever Need,” incorporating Social Security and other non-portfolio income sources, as well as estimation of federal taxes.
This document describes the structure of the model. It is not individualized financial advice and does not guarantee future results.
Conceptual Framework
The Best Third separates retirement income into two components or layers:
- The Base Income (Secure Layer) is the minimum income a person or household would like to ensure will be available to them, year in and year out. A higher Base Income reduces potential total spending in exchange for a higher income floor.
- The Bonus Income (Variable Layer) is the fluctuating annual income produced by investing in a stock index fund or portfolio. This layer includes the risk of loss of capital in exchange for the potential of growth and greater total spending and/or final estate value.
Base Income (Secure Layer)
Base Income consists of:
- Social Security
- Other non-portfolio income sources, such as pensions, rental income, or part-time earnings.
- Cash flows from a ladder of Treasury Inflation-Protected Securities (TIPS)
TIPS are used because, when held to maturity, they provide contractual, inflation-adjusted cash flows backed by the U.S. Treasury. Among publicly traded securities, they represent the lowest-risk asset for delivering real spending power at known future dates.
The user specifies a target after-tax Base Income for each year. The TIPS ladder is constructed so that, after estimated federal taxes, Base Income meets the user’s specified yearly targets (expressed in today’s dollars).
Bonus Income (Variable Layer)
Bonus Income is provided by systematic withdrawals from a stock index portfolio.
Rather than withdrawing a fixed dollar amount, the methodology determines at plan inception a percentage of the remaining stock portfolio to withdraw in each year.
- The yearly percentages are fixed.
- The dollar amount varies with realized market returns.
- Bonus income therefore adjusts dynamically to market outcomes.
The user specifies the annual Bonuses in terms of relative weights to indicate which years are preferred to receive higher versus lower Bonus Income. The weights determine the yearly withdrawal percentages so that years with higher weights have proportionally higher statistically expected Bonuses than years with lower weights. Where statistically expected means the value of the Bonus in a year with an average sequence of stock market returns. For example, if year A has a weight of 1 and year B has a weight of 0.75, then under average sequences of returns for both years, the Bonus in year B would be ¾ of the Bonus in year A. If you prefer higher average Bonuses, say, in early retirement than in later retirement, then you would set higher weights for the early years than for the later years. For equal expected Bonuses every year, set all weights to 1. While setting weights makes higher Bonuses more likely in years with higher weights, it does not guarantee higher Bonuses in those years, due to variability in market returns.
Together, the Secure Layer and Variable Layer provide:
- Stable Base Income, regardless of market conditions.
- Upside participation through equity exposure.
- Implicit downside risk management.
User Inputs
The model incorporates the following inputs:
Household Characteristics
- Birthdates
- Social Security start ages
- Gross monthly Social Security benefits (before deduction of “IRMAA” Medicare premiums, which are estimated with taxes)
Retirement Timing
- Intended withdrawal start date
- Planning horizon (final year in plan)
Non-Portfolio Income
- Amounts
- Start and end dates
- Tax characterization
- Inflation-indexing — is the income source expected to rise with CPI or is it in nominal dollars?
Investment Accounts
- Current balances
- Tax classification (taxable, tax-deferred, tax-exempt)
- Ownership (individual or joint)
Income Targets
Users specify:
- Base Income target (after-tax, inflation-adjusted dollar amount)
- Bonus weights (relative weights across years)
Income targets may be configured in one of three ways:
- Constant — the Base Income is set to a specific value for every year. The Bonus weights are all set to 1.
- “Typical” retirement pattern — Both Base and Bonus are higher early in retirement and decline over time, with a late-life increase anticipating higher medical expenses.
- Custom year-by-year specification — the user can enter Base target and Bonus weights for every year or range of years.
As explained in an earlier section, the Bonus weights determine the relative expected value of Bonus income across the years.
Inflation Assumptions
- All dollar values are reported in current-year dollars.
- Most of the key drivers in the model are inherently indexed for inflation. Their future values can be stated in current dollars without making any assumptions about future inflation. E.g. TIPS cashflows, Social Security benefits and any non-portfolio income sources that are identified as inflation-indexed will be projected into the future as constant.
- The ranges for future stock market returns used to project the ranges of Bonus income, as illustrated in the After-tax Income graph, are derived from historical real stock market returns.
- Some dollar values used in tax calculations are CPI-indexed by statute, and the current values are projected forward as constant. Other values in the tax code are in nominal dollars. More detail on this in the tax section below.
- Non-indexed dollar values (such as non-indexed incomes, and nominal values in the tax code) are decreased annually by an inflation factor to be consistent relative to the inflation-indexed numbers.
- The model uses a constant 3% for the inflation factor, i.e. a multiplicative value of 1.03. This is not intended as a forecast of actual future inflation.
Tax Modeling Framework
The tax module is designed to approximate federal income tax liability under simplifying assumptions with reasonable directional accuracy. It is not intended to replicate IRS form-level exactitude. The 2026 tax rules are projected into the future with certain inflation assumptions and incorporating known statutory changes. We will update our implementation annually pursuant to IRS updates of the rules for each new tax year. Users will be notified and encouraged to update their plans accordingly.
Filing Status Assumptions (automatically applied)
- Married Filing Jointly (for married couples)
- Single (not Head of Household)
Deduction Assumptions (automatically applied)
- All households take the Standard Deduction. There are no itemized deductions.
- Senior deduction where applicable
- Temporary OBBBA senior bonus deduction (through the statutory end year of 2028)
No dependent deductions are assumed.
No blindness deduction is assumed.
Inflation Assumptions
Inflation-indexed tax parameters (e.g., bracket thresholds, standard deduction) are assumed to grow with CPI and held as constant, per the Inflation Assumptions section above.
For statutory values that are not indexed (e.g., Net Investment Income Tax thresholds, Social Security taxation thresholds, capital loss offset limits, OBBBA senior bonus deduction values), the values are decreased annually by the inflation factor for modeling consistency so that real-dollar comparisons remain relevant across years.
This is a modeling choice designed to maintain internal real-dollar consistency, not a prediction of statutory changes.
IRMAA Modeling
Income-related Medicare premium adjustments (IRMAA) are estimated using published CMS tables (2026 baseline), with thresholds modeled as CPI-indexed for forward projections, therefore held constant as described in the Inflation Assumptions section. Current numbers will be updated annually pursuant to CMS announcements. See: https://www.cms.gov/newsroom/fact-sheets/2026-medicare-parts-b-premiums-deductibles
Medicare charges IRMAA payments based on income from 2 years prior. In the TBT modeling, IRMAA is included in the federal tax estimate for the income year that generates it.
Capital Gains Treatment
- All gains are assumed to be long-term.
- Initial taxable stock basis equals market value.
- The capital loss offset against ordinary income is limited to a nominal $3,000 (not indexed).
- Excess losses are carried forward.
Social Security Taxation
The taxable portion of Social Security is computed per the IRS Social Security Benefits Worksheet, included in the Form 1040 Instructions.
Asset Allocation and Location
Allocation Logic
The model determines the quantities and maturity dates of TIPS to be purchased now required to mature each year and fund the Base Income Gap (target Base Income less other income sources).
TIPS are assumed to be purchased within accounts which fall into each of the tax buckets in the following priority:
- First, within Tax-deferred accounts
- Then, within Tax-exempt accounts
- Finally, within Taxable accounts
Rationale:
- Tax-deferred accounts shelter annual phantom inflation accrual.
- Taxable accounts are least efficient for holding TIPS due to ordinary income tax on interest as well as on the “phantom” tax on unrealized appreciation from inflation indexing.
- The slowest growing assets (bonds) should be placed in the Tax-deferred bucket, in order for the highest growth assets (stocks) to enjoy preferential tax treatment in the Taxable bucket or grow untaxed in the Tax-exempt bucket.
- Tax-exempt accounts are preserved where possible for long-horizon equity growth because all of those gains can be realized free of tax.
If TIPS span multiple buckets, the TIPS are placed in these buckets by order of maturity:
- Earliest maturity TIPS in Taxable accounts
- Later-maturity TIPS in Tax-deferred accounts
- Remaining, latest-maturity TIPS in Tax-exempt accounts
After TIPS are allocated, all remaining balances are allocated to equities.
Withdrawal Sequencing
Maturing principal and coupon payments are withdrawn upon receipt.
Stocks are withdrawn from the buckets in this order:
- Taxable
- Tax-deferred
- Tax-exempt
This differs from conventional mass-market advice that delays tax-deferred withdrawals until taxable assets are exhausted and delays tax-exempt withdrawals until tax-deferred assets are exhausted.
Simulation testing indicated that concurrent withdrawal of taxable equity and tax-deferred bond income often improves tax efficiency.
This is a choice used for the purposes of this model, not a universal prescription.
Stock Return Assumption and Withdrawal Formula
The withdrawal percentages are derived assuming a constant 6.9% real stock return, approximating long-run historical U.S. real equity returns.
This assumption is used solely to calibrate relative Bonus weights across years.
Actual projected outcomes use historical rolling return sequences (Shiller data, 1871–present).
Withdrawal percentages remain fixed unless plan inputs change.
In the case that unplanned capital flows occur, e.g. a material influx of liquid assets from inheritance or property sale; or if past stock withdrawals have been materially different from the plan — in such cases it is recommended to regenerate the plan based on the new circumstances.
Treatment of Dividends in Taxable Accounts
In taxable accounts:
- Dividends are assumed at a constant 1.4% yield.
- Dividends are not reinvested.
- All dividends are assumed to be qualified.
While we rely on historical real total returns, the 1.4% dividend assumption reflects recent historical dividend yield ranges rather than long-run historical averages, acknowledging structural shifts in payout policy.
This is a simplifying assumption and may differ from future realized dividend yields.
Dividends in the model count toward the total annual withdrawal percentage from the stock portfolio. The portion of the withdrawal attributed to dividends is solely for the purposes of estimating the tax on dividend income in taxable accounts.
Determining the TIPS Ladder
For each year, gross TIPS cash flow is determined such that:
Non-portfolio income + TIPS cashflows − Estimated Federal Tax = after-tax Base Income Target
The Estimated Federal Tax calculation in this equation only considers the sources for Base Income and does not include withdrawals from the stock portfolio. Incremental tax arising from stock withdrawals is estimated along with the stock withdrawals. If non-portfolio net income alone meets the Base target in a given year, no TIPS maturing that year are allocated. However, interest from later maturing TIPS is modeled as income for that year.
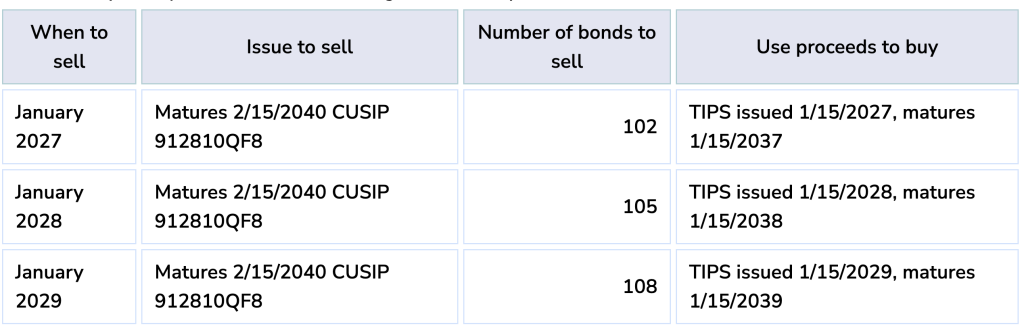
There are no outstanding TIPS issues which mature in the years 2037, 2038 or 2039. It is the Treasury’s current practice to issue new 10-year TIPS every January and July and a new 30-year TIPS every February. It is anticipated that by 2029 there will be a TIPS maturing in every year through 2059. In the meantime, to provide Base income for 2037–2039, TBT uses additional 2040 TIPS, to be sold, with the proceeds rolled over to newly issued 10-year TIPS in 2027, 2028 and 2029.
Where TIPS maturities do not extend to the end of the planning horizon, the final rung includes capital sufficient to purchase an extension ladder at that time. Future yields are unknowable; this is a structural placeholder.
Interpreting the Output for an Example Plan
The application displays:
- Allocation by tax bucket
- Projected after-tax income ranges
- Historical percentile outcomes
- Historical scenario replay
- TIPS purchase list
- Fixed, annual stock withdrawal percentages for each year
Historical scenario replay illustrates full-path dynamics rather than year-by-year percentiles.
The following is an example for a married couple, born 1962 and 1964, with a total of $1.5M in financial assets, commencing withdrawals in April 2027, a time horizon of 2058, a total of $6,600 in monthly Social Security benefits with one spouse starting benefits in 2031 and the other in 2033. Their desired after-tax Base Income is $80,000.
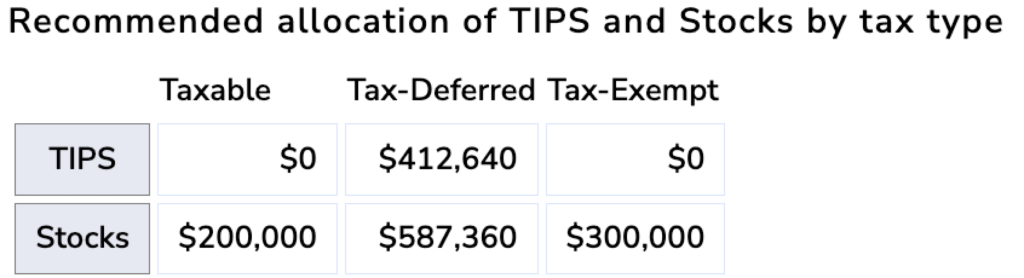
The first table shows the portion of each tax bucket to be allocated to TIPS vs stocks. The tax buckets are taken as a whole, without considering the various accounts that may comprise the buckets.
The chart below illustrates the projected range of after-tax income in today’s dollars. Percentile curves are derived from historical return sequences in our data set (Shiller’s monthly stock, bond and inflation data from 1871–present. Publicly available at shillerdata.com). They do not represent fixed-probability forecasts. The return sequences we use are overlapping, starting with every month in the data set.
The orange line at the bottom shows the Base Income. The lines above show the total income including Bonus, also after-tax and in today’s dollars. For each year, the red point represents the lowest income outcome generated by the overlapping return sequence of equivalent length in our historical data.
The dark blue, lighter blue and light grey lines respectively represent the 5th, 20th and 50th percentiles of outcomes based on historical sequences of returns.
Take for example 2042, or 16 years from the present. Looking at all overlapping 16-year sequences of U.S. stock returns in the data set — if the actual cumulative return of the U.S. stock market over the next 16 years is the same as the worst historical 16-year cumulative return, then this household’s total after-tax income in 2042 will be equal to the 2042 red dot on the chart, about $100,000. Similarly, if the cumulative return for the next 16 years is equal to the median of the historical 16-year cumulative returns, the household’s 2042 total after-tax income will be nearly $160,000.
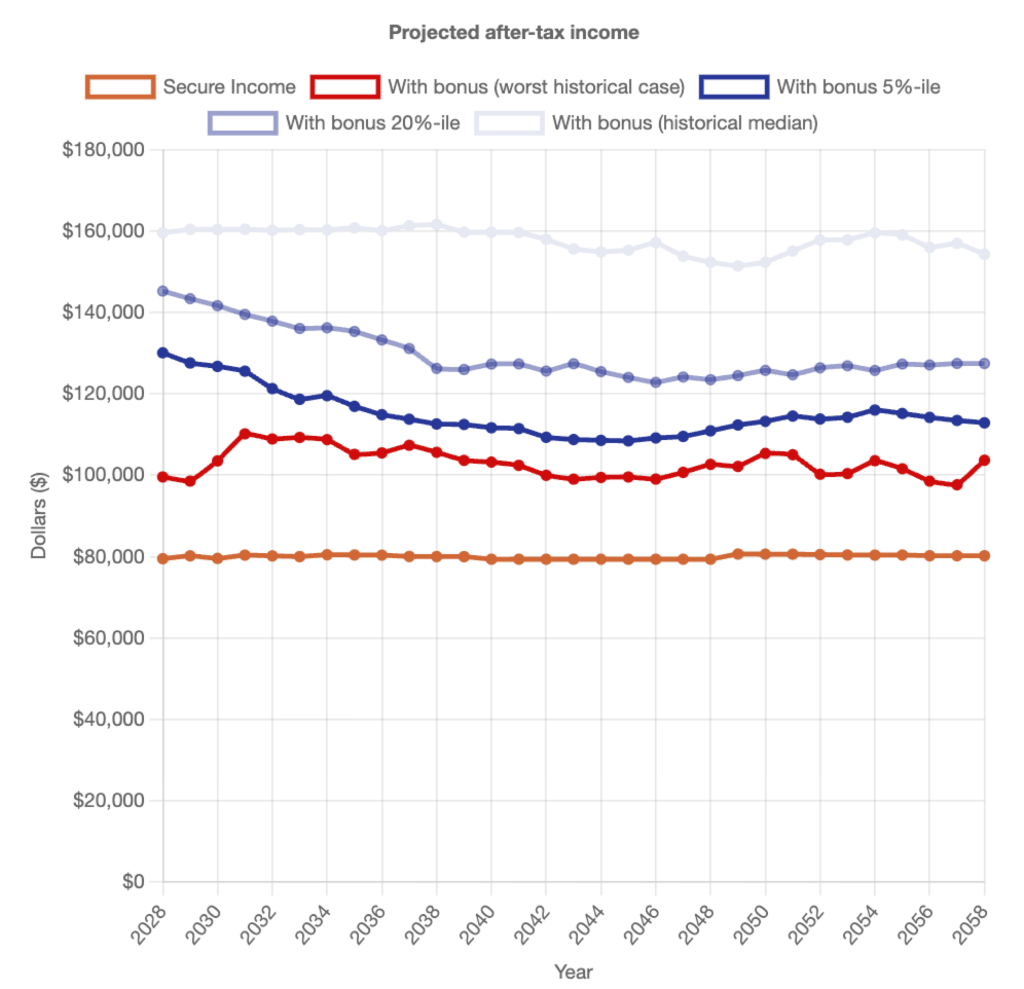
Each percentile point is calculated independently for each year. Actual realized paths will typically move across percentiles rather than remaining at a fixed quantile over time.
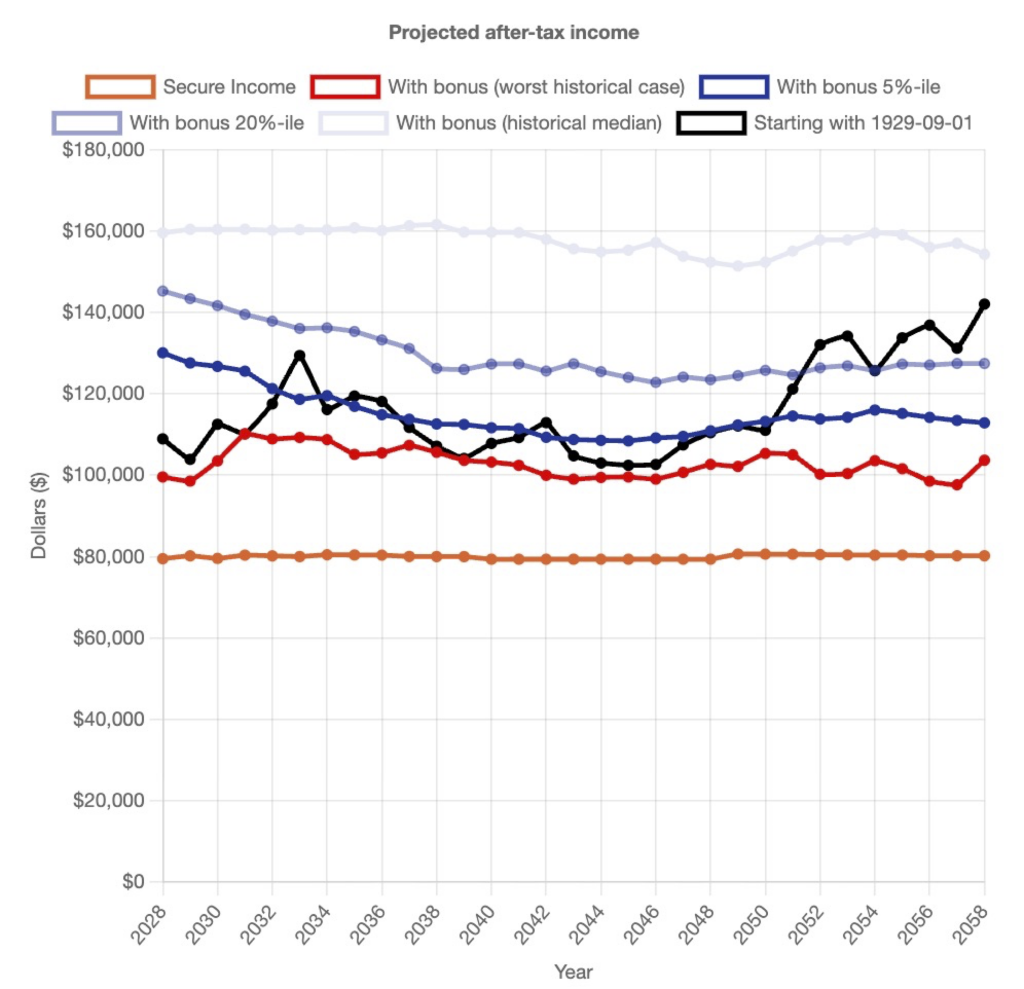
The “See how your plan would fare if stock returns during your retirement are similar to a historical period” feature illustrates what historical return sequences have looked like. Take what is perhaps the most notorious market scenario in history — the 1929 Crash. What would this household’s retirement look like if they set this plan today, and they experience the same return sequence, with a crash of the same magnitude in the first month? The black line in the graph below shows the results. If this household were to experience a replay of the stock market returns starting with the 1929 Crash, their Base income would still be met, but Bonus incomes would be relatively low in the early years. As the market recovers (in a replay of the post-war boom) the annual Bonus would increase over time.
The table that appears after clicking on “Show table of projected after-tax income” is the same data as in the “Projected after-tax income” graph, but in tabular form.
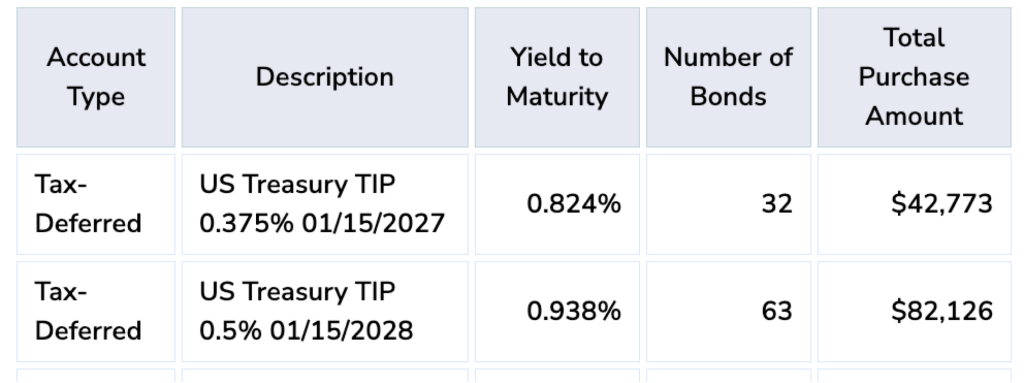
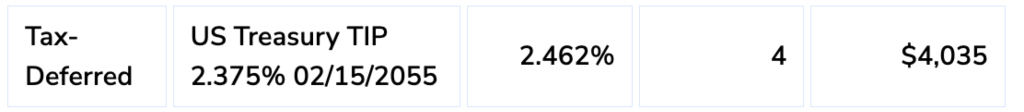
The table that appears after clicking on “Show list of TIPS to be purchased” presents all of the TIPS to buy to implement the ladder that will meet the desired Base Income target, including the tax bucket in which to buy the issue and the number of bonds to buy. The bond’s description indicates the date on which the bond will mature. The Total Purchase Amount is the cost to buy the given number of bonds, including accrued interest, based on recent prices. The actual costs fluctuate.
…
At this writing there are no TIPS issues that mature during the years 2037-2039. As a bridge, additional 2040 issues would be purchased. The Treasury currently issues new 10-year TIPS every January and July. When a new 10-year is issued in January 2027, it is recommended that some of the 2040s be sold, with the proceeds rolled over to purchase the 2037 issue. Similarly for 2028 and 2029.
…
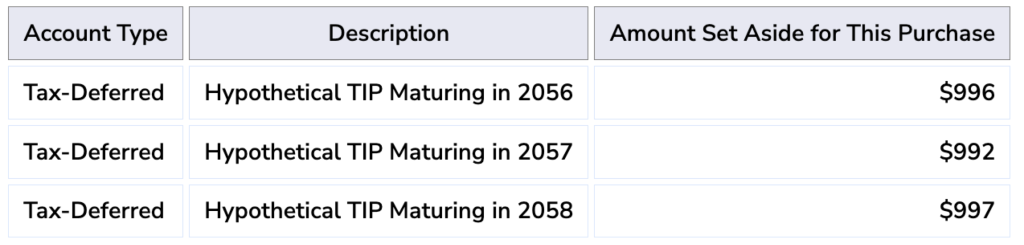
At this writing, the longest available TIPS mature in 2055. This household is planning to include TIPS in its Base Income for a few years beyond 2055. The solution is to include enough bonds in the 2055 rung of the ladder so that a new ladder can be purchased in 2055 to cover the final years of the plan. The bottom table shows the amount budgeted to each year of the extension ladder for TIPS to be purchased to mature in those years. Of course, the prices/yields on TIPS in 2055 are yet unknowable.
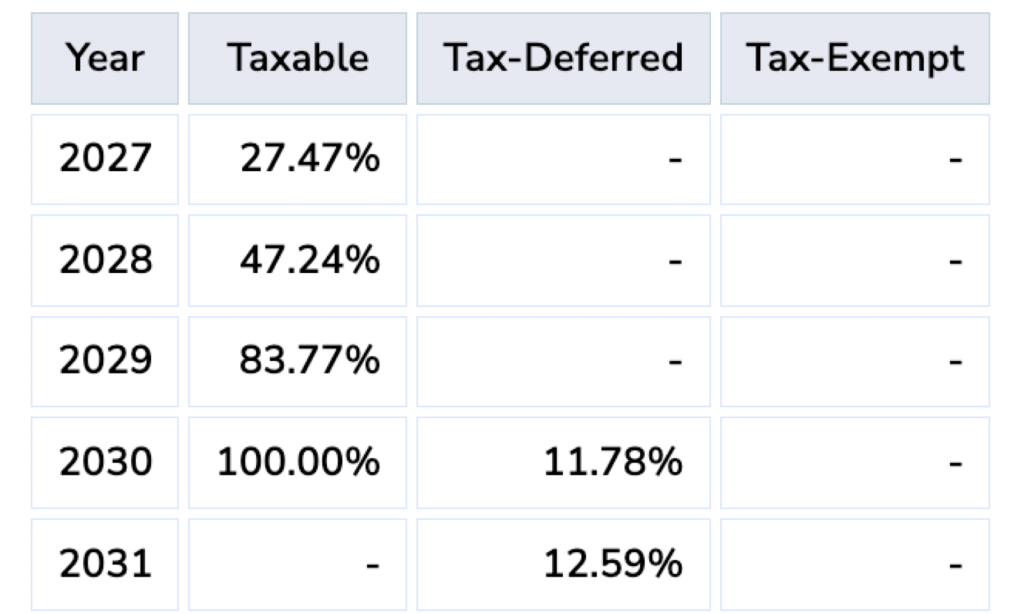
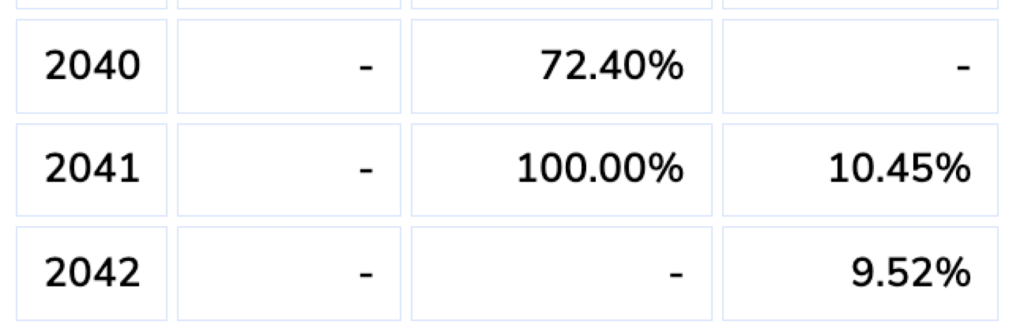
The table that appears after clicking on “Show sequence of stock withdrawals” shows the percentage of that year’s remaining stock value in each tax bucket that should be liquidated and withdrawn that year. The specific dollar value that is withdrawn will depend on the market value at that time. But the percentages remain fixed unless and until the user changes the plan.
In the absence of a change to the plan, in 2028 47.24% of the stock in the Taxable bucket should be withdrawn. Dividends received that year should count towards the value withdrawn, as discussed above. In 2030, all of the remaining Taxable stock should be withdrawn in addition to 11.78% of the Tax-deferred stock. In 2041, all of the remaining Tax-deferred stock should be withdrawn along with 10.45% of the Tax-exempt stock, etc.
…
Income and Tax Details for This Example
We look closely at two different example years for this household plan and consider the income and tax picture for these years under the assumption that stock returns are at the 20th percentile. Taxes are based on extrapolated 2026 tax rules, and all figures are in 2026 dollars. Actual statutory tax changes may materially alter outcomes.
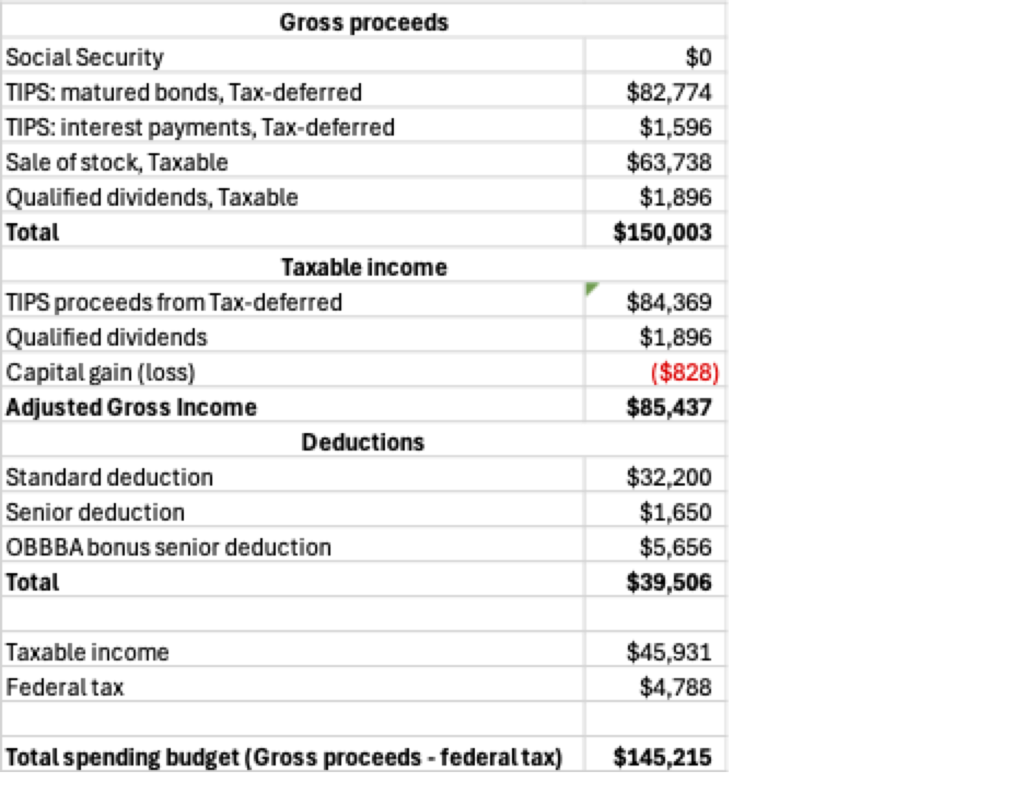
2028 is the first full year without employment income. Social Security is not tapped for either spouse yet. One of the spouses is eligible for the senior tax deduction. To attain $80,000 of after-tax real Base income, the ladder is configured to provide all the gross Base income so that the after-tax Base is $80,000. All TIPS are in the Tax-deferred bucket, so all such proceeds are taxed as ordinary income. The Bonus comes from liquidating and withdrawing stock from the Taxable account, which includes qualified dividends and sale of stock (in this case with a capital loss). The total gross withdrawal is $150,003. Estimated federal tax is $4,788. The total after-tax spending budget is therefore $145,215. The table shows the calculations.
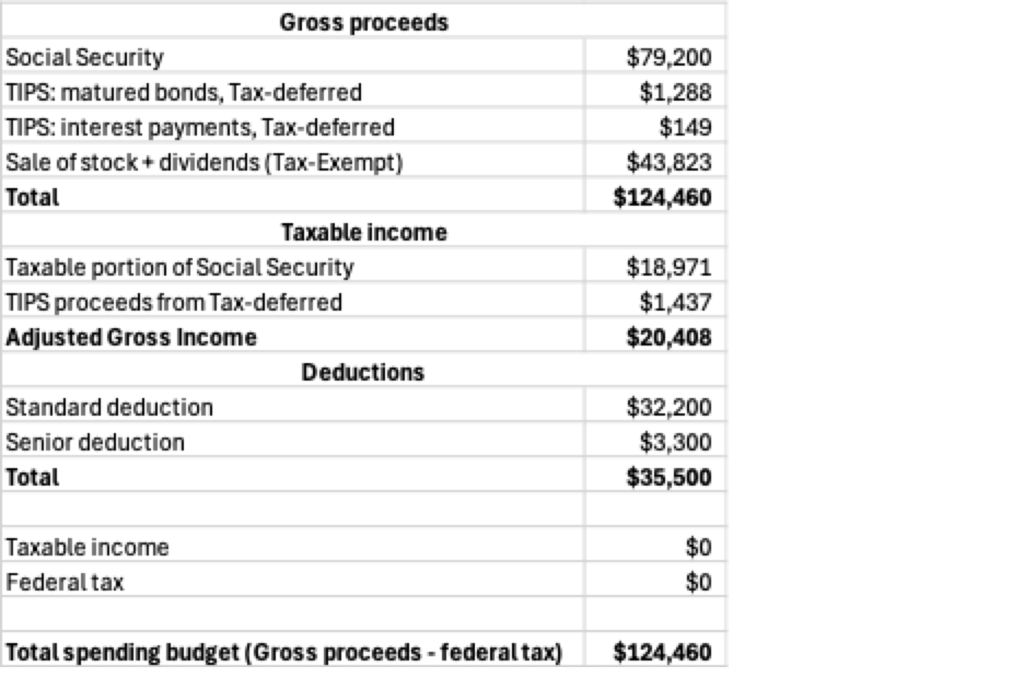
In 2049, both spouses receive Social Security, for an annual total of $79,200. Both spouses are eligible for the senior tax deduction. Based on what is known today, the current OBBBA bonus senior deduction does not apply in 2049. The stock in both the Taxable and Tax-deferred buckets would have been depleted. The entire stock withdrawal is from the Tax-exempt bucket. Only a small amount of TIPS remains in the Tax-deferred bucket, since little is required to supplement Social Security to reach the $80,000 Base income target. The taxable income from Social Security and the Tax-deferred withdrawal is less than the available deductions and no federal tax is owed. The total after-tax spending budget is $124,460.
What This Methodology Is Not
- Not a Monte Carlo simulation.
- Not probability-of-success/failure modeling.
- Not utility maximization.
- Not glidepath rebalancing.
- Not annuity substitution modeling.
- Not a dynamic optimization engine.
It is a rule-based, tax-aware income construction framework grounded in:
- Inflation-hedged base funding
- Percentage-based equity withdrawals
- Historical sequence stress testing
Known Limitations and Planned Enhancements
Not currently implemented:
- Early retirement penalty modeling
- Explicit legacy reserve
- Detailed RMD optimization
- Roth conversion modeling
- State tax modeling
- Embedded capital gain basis modeling
- Annuity integration
- Pre-retirement accumulation
- One-time capital inflows
These are planned areas of research and development.
Update log
2026-03-10: For the “gap years” in the 2030s where there are no maturing TIPS, use 2040s as a bridge, instead of the previous method of STRIPS.
Copyright 2026 Useful Work, Inc. d/b/a The Best Third